
 AT
AT
 DE
DE
 DE
DE
 UK
UK
 INT
INT



Management approach – our why
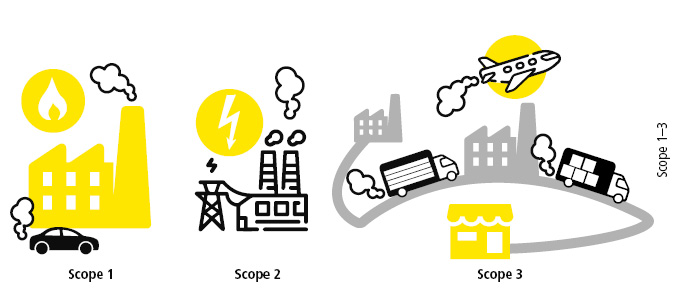
As an industrial company that produces high-quality access systems, EVVA has a corresponding energy requirement. EVVA itself emits greenhouse gases (GHG, Scope 1) via heating and its vehicle fleet. Our emissions are steadily decreasing due to the switch from gas to green electricity and to electric vehicles. For Scope 2 - specifically purchased electricity -all EVVA production sites have already reached a key milestone: since 2022, the Vienna headquarters has sourced 100% of its electricity from renewable sources, as have the production sites in Krefeld and Tišnov since 2026. As a result, market-based Scope 2 emissions from electricity procurement have been reduced to zero. The largest GHG factor is Scope 3, i.e. emissions that occur in the upstream and downstream value chain. Brass is our most important production material and is required in large quantities for the production of our security cylinders and keys. Brass production at our suppliers causes correspondingly high GHG emissions.
For this reason, EVVA has defined GHG emissions as a material negative impact in our own business activities and also in the value chain. Our emissions relate almost exclusively to CO2. Only refrigerants for air conditioning systems, which only need to be refilled every few years, contain very small amounts of fluorinated gases, which are taken into account in Scope 1. Our GHG targets and measures contribute to achieving the EU’s Green Deal.
Our CO2 footprint. Gross GHG emissions (ESRS E1-6)
The following table shows the greenhouse gas (GHG) emissions from the Vienna headquarters, by far EVVA's largest power plant, which accounts for approximately 90% of the energy demand of all three production sites (Vienna, Krefeld, Tišnov). The other EVVA subsidiaries are primarily sales locations and have very low energy consumption and GHG emissions.
Notes on the table:
-
Scope 1 = own emissions (heating, fleet); Scope 2 = emissions of purchased electricity; Scope 3 = indirect emissions from the upstream and downstream value chain, e.g. from suppliers
-
“Location-based according to GHG Protocol” means: determined average emission factor of the regional electricity grid. It represents the energy mix of the regional electricity grid. “Market-based” means: emissions based on a company’s contractual electricity tariff; taking into account how the electricity was produced. The market-based calculation therefore reflects a company’s individual efforts to procure electricity in a more climate-friendly way!
-
The basis for our scope calculations is the GHG protocol, the ecoinvent database 3.10 and 3.11 as well as information from suppliers. Information on estimated values is given in the ESRS index under item ESRS 2, BP-2
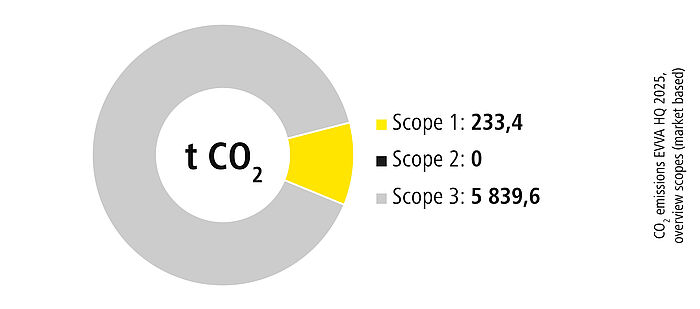
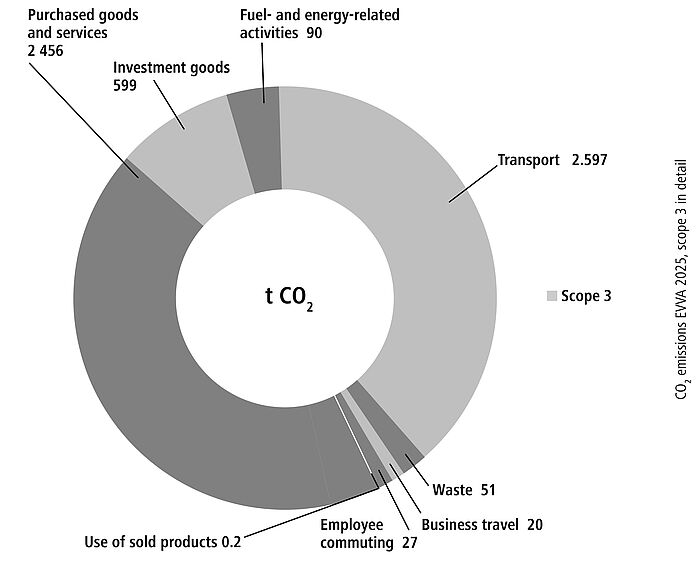
Information in tonnes of CO2 equivalent (CO2 e) for all three scopes and total
| EVVA headquarter | 2025 | 2024 | 2023 |
|---|---|---|---|
| Scope 1 | |||
| Gross GHG emissions Scope 1 (t CO2 e) | 233.4 t | 262.3 t | 354.9 t |
| % from regulated emissions trading schemes | 0 % | 0% | 0% |
| Scope 2 | |||
| Market-based gross GHG emissions Scope 2 (t CO2 e), EVVA purchases 100% of its electricity from renewable sources | 0 t | 0 t | 0 t |
| Location-based gross GHG emissions Scope 2 (t CO2 e), according to the Austrian Federal Environmental Office | 1,140.2 t | 1,201.9 t | 1,293.2 t |
| Scope 3 | |||
| Total indirect gross GHG emissions Scope 3 (t CO2 e). Divided according to GHG protocol into: | 5,839.6 t | 5,604.3 t | 6,461.7 t |
| 1 Purchased goods and services | 2,455.8 | 2,541.3 | 2,860.5 |
| 2 Capital goods | 599.2 | 428.2 | 849.4 |
| 3 Activities related to fuels and energy (not included in Scope 1 or 2) | 89.6 | 98.5 | 123.8 |
| 4 Upstream transport and distribution | 2,596.9 | 2,284 | 2,338.1 |
| 5 Waste generation in operations | 51 | 10.25 | 10.8 |
| 6 Business trips | 20 | 14.4 | 30.8 |
| 7 Commuting employees | 27 | 227.5 | 248.1 |
| 8 Upstream leased assets | - | - | - |
| 9 Downstream transport | - | - | - |
| 10 Processing of sold products | - | - | - |
| 11 Use of sold products | 0.2 | 0.2 | 0.2 |
| 12 Treatment of products at the end of their service life | - | - | - |
| 13 Downstream leased assets | - | - | - |
| 14 Franchises | - | - | - |
| 15 Investments | - | - | - |
| Total GHG emissions | |||
| Total Market-based (t CO2 e) | 6,073 t | 5,866.6 t | 6,816.6 t |
| Total Location-based (t CO2 e) | 7,213.2 t | 7,068.5 t | 8,109.8 t |
EVVA CO2 footprint decreased in Scope 1, increased in Scope 3
Total GHG emissions from the headquarters decreased by 950 tons from 2023 to 2024. However, the Corporate Carbon Footprint (CCP) increased slightly in 2025. Here are the reasons for each scope:
Scope 1 Reduction:
Our Scope 1 emissions were reduced by 92.6 tons in 2024 compared to 2023 and decreased again by approximately 30 tons in 2025 compared to 2024. Key drivers of this development were the lower gas consumption resulting from heat recovery through the new compressors, which have been in operation since November 2024, and the continuously increasing proportion of electric vehicles in our fleet.
Scope 2 CO₂-free:
Since January 1, 2022, EVVA headquarters has been sourcing 100% of its electricity from renewable sources, thereby reducing market-based Scope 2 emissions from electricity procurement to zero. The two other production sites in Krefeld and Tišnov have also been sourcing electricity from renewable sources since 2026, making them CO₂-free regarding Scope 2 electricity procurement (market-based calculation).
Increase in Scope 3:
- "Purchased goods and services" is a key Scope 3 value for EVVA, as it includes emissions generated during the production of, for example, brass. Brass is the most important material for the manufacture of our security products. These emissions have decreased by approx. 400 tons since 2023, partly due to the lower purchasing volume of various resources. This decrease is also due to the increased recycled content of the brass and nickel silver we purchase.
- Capital goods: EVVA made significant investments in machinery in 2025, which is why this value increased, and consequently, so did the overall Scope 3 figure.
- "Downstream transport": According to the GHG Protocol, transport from EVVA to customers is also considered "upstream" if external logistics partners are used. Therefore, these deliveries are included under "4: Upstream transport and distribution" and not under "9: Downstream transport." The value increased in 2025 due to higher transport volumes.
- "Commuting employees": this value decreased compared to the previous year. This is because the calculation is based on the new 2025 data from the Austrian Federal Environment Agency (with 2024 as the reference year). Last year's figure was still based on the Ecoinvent data sheet from 2000.
- Waste volume: The Scope 3 calculations for waste in 2023 and 2024 were incorrectly transferred to the report. However, the 2025 figure of 51 t is correct. This explains the increase compared to previous years. In the interest of transparent reporting, the 2023 (actually 30 t instead of 10.8 t) and 2024 (actually 48.1 t instead of 10.25 t) figures were not overwritten. Our existing Scope targets remain unchanged.
- “Processing of sold products”: EVVA already delivers finished products
- “Use of sold products”: This factor is practically unimportant at EVVA, because our mechanical access solutions do not consume any energy when in use and our electronic solutions also have extremely low emissions via batteries. This means EVVA products cause virtually no CO2 emissions for customers and partners in daily use
- “Treatment of products at end of service life”. EVVA products have a very long service life – e.g. 30 years with 100,000 locking cycles for mechanical cylinders according to the EPDs (Environmental Product Declarations) – and are often used across generations. We therefore do not know how many EVVA products are disposed of in order to calculate a recycling rate and GHG


Our targets and actions to further reduce emissions (ESRS E1-3 and E1-4)
EVVA has implemented or planned the following objectives and measures. Additional information on transition plans can be found in the ESRS index under E1-1. The GHG targets initially relate to the EVVA headquarters with its main production site.
Notes on the table:
-
The methodology and validation of objectives includes: our own energy management system with a new calculation of the GHG accounting, own measurements and information from external service providers (energy supplier, compressor manufacturer). The goals are evaluated by the EVVA “Global Industrial Engineering” or “Logistics & Purchasing” units
-
EVVA bases its climate strategy on science-based targets. Further details and the corresponding reduction pathway can be found in the ESRS Index, E1
-
The original goal of being Scope 1 Net zero by 2030 is currently not achievable. Electricity is 2-3 times more expensive than gas, making it economically difficult to quickly switch to electricity. EVVA has therefore extended the target to 2035
EVVA target | Planned CO2 reduction | Starting Year | Target Year | Progress |
|---|---|---|---|---|
| Long-term target | ||||
Net zero for Scope 1 | Net zero. Remaining, unavoidable residual emissions are equalized or neutralized in accordance with recognized standards.
| 2020: | 2035 | Approx. 50% achieved. |
| Near-term targets | ||||
| Use waste heat from new compressors. They are integrated in the heating return | 246 t | 2024 | 2027 | Compressor integration: 100%; |
| Renovation of roof structures including thermal insulation | 12 t | 2025 | 2027 | 30% |
| EVVA target Scope 2 | Planned CO2 reduction | Starting Year | Target Year | Progress |
|---|---|---|---|---|
Purchased electricity from 100% renewable energy sources | Net Zero (market-based calculation)
| 2020: | 2030: | already 100% in all 3 EVVA Power Plants (since 2022 in Vienna, since 2026 in Krefeld and Tišnov) |
| EVVA target Scope 3 | Planned CO2 reduction | Starting Year | Target Year | Progress |
|---|---|---|---|---|
Reduce Scope 3 emissions by 35% | 2,262 t less | 2023: | 2030: | 28% achieved. |
The implementations in detail:
- Integration of the compressor waste heat into the heating return
Since 2024, the waste heat from the existing and newly purchased compressors (which generate the compressed air for production) has helped to gradually replace the gas for heating. To achieve this, heat exchangers are installed in the compressors that direct the waste heat into the heating return.
Two compressors are already fully integrated into the heating return system. In the first phase, the main boiler room (which covers the majority of the total heating demand) was replaced. The waste heat from a third compressor is used for temperature control via an exhaust duct. In winter, the heat is directed into the building, thus saving heating gas; in summer, it is dissipated, saving energy for cooling and air conditioning systems. EVVA is first evaluating the experience gained from the use of compressor waste heat before implementing further plans for recovering waste heat from other machinery.
Positive effects:
The calculated energy saving from heat recovery by 2027 is 1.210,000 kWh, i.e. 1.21 GWh. The CO2 saving is 246 tonnes. The waste heat from the compressors therefore contributes significantly to our net zero target for Scope 1. Currently, 50% of the savings target has been achieved.
- Renovation of several roof structures including thermal insulation
Several roofs above the headquarters will be completely renovated and re-insulated. This will reduce the heat demand.
Positive effects:
The savings are estimated at 50,000 kWh or 12 t CO2. However, the focus of the project is on improving the building structure.
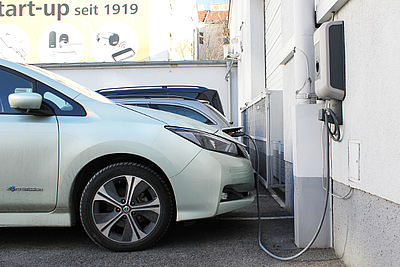 Conversion to electric fleet
EVVA is pushing for the switch to electric vehicles where it makes sense. Although an electric car is not yet ideal for every purpose – such as long-distance sales trips – the ranges are improving all the time. As more electric vehicles and fewer conventional cars are to be produced in the future, the trend is clearly moving towards electric mobility.
The use of combustion-engine vehicles at EVVA is steadily declining, while the use of electric vehicles is increasing. At the start of 2026, the share of electric vehicles in the headquarters fleet was 32% (14 pure electric cars, 6 hybrid/petrol vehicles, 2 petrol vehicles, 22 diesel vehicles. Total fleet: 44 vehicles). At the start of 2025, it was 26% (11 pure electric cars out of a total of 41 vehicles), 20% in 2024, and 10% in 2023.
Positive effects:
CO2 emissions from the headquarters fleet will continue to decline in the coming years, reducing our Scope 1 share. In 2020, the headquarters’ fleet still emitted 171 t of CO2, mostly from diesel vehicles. Only 73.9 t in 2024 due to the ongoing switch to electric cars.
- Share of regional suppliers increased to 98%
A high share of regional suppliers (EVVA defines "regional" as a 1,000 km radius around its headquarters) generally results in shorter transport routes. This can reduce transport-related emissions. For details, see Proportion of regional suppliers.
Positive effects:
According to calculations by EVVA's “Logistics & Purchasing” unit, approx. 1 million euros of EVVA’s purchasing turnover remains in the region, helping to secure or create jobs for suppliers. The shorter transport routes (less air freight from Asia) saved over 100 tonnes of CO2 (2023: 168 t GHG based on medium/long flight distance; only 41 t in 2024). Transports to EVVA (e.g. from the brass supplier to EVVA headquarters) involve larger delivery volumes per trip, but since there are only few such trips, they also cause lower GHG emissions. This is unlike EVVA’s outgoing transports (e.g. from headquarters to subsidiaries or trading partners): although delivery volumes here are lower, the more frequent individual trips to different countries result in higher GHG emissions.
- On track for CO₂-free delivery by 2030 (as stated on https://www.post.at/en/ir/c/co2-free)
Since 2026, customers in Austria have benefited from EVVA’s proven security with an even greater focus on environmental responsibility: EVVA parcels are delivered through our partnership with Austrian Post. Austrian Post aims to make its last-mile delivery completely free of direct CO₂ emissions by 2030 – achieving this through measures such as the ongoing expansion of its electric vehicle fleet and the use of renewable energy. The postal service offsets any remaining, currently unavoidable emissions by supporting certified international climate protection projects. We will show how this development impacts our Scope 3 footprint in the next update covering the year 2026.
- Continue to increase the recycled content of purchased materials
Among other things, we want to reduce the Scope 3 share through intensive dialogue with suppliers. A major lever here is the procurement of secondary instead of primary materials. Read more about our respective goals under Circular Economy overview
- 50% travel subsidy
from EVVA for employees at headquarters. These subsidies only apply to public transport, not to cars. This creates an incentive to use public transport and reduces the environmental impact of private vehicle use.
- Clean production
EVVA’s much lower oil requirements also mean fewer oil transports from the refineries - and the oil does not have to be disposed of through a lenghty process. More information under Clean Production
- Energy-savings
EVVA already purchases 100% renewable electricity at its three production sites, but is taking additional measures to generally increase energy efficiency more broadly. For more information, see Power Management system. We also generate energy ourselves from solar power via our PV systems. More information can be found in the photovoltaics section
How would you like to share?